The Table View in Aimsun Next transport modelling software lists objects of a specific type together with all of their attributes.
Aimsun Next can filter the objects by certain conditions and attributes. In this technical note, we will review the filters that we can apply, the functionalities available, and how to make most of them in the lifecycle of a project.
Note: in versions 20, 22 and 23 of Aimsun Next, the Table View contents are dependent on the Active Scenario: only objects that exist in the scenario (after applying Geometry Configurations) are listed. In future versions of Aimsun Next, all objects will be listed, independent of the Active Scenario. We will also add a new option to list only objects that exist in the Active Scenario.
How to use the Table View to verify the network coding:
Open the Table View window by pressing letter t on the keyboard. This is a shortcut for showing or hiding the Table View. Note that this shortcut only works if the current active window is a 2D or 3D view – just click somewhere in the background of the 2D view to make sure that’s the context. If you don’t recall the shortcut, you can open the Table View by going to Window -> Windows -> Table View.
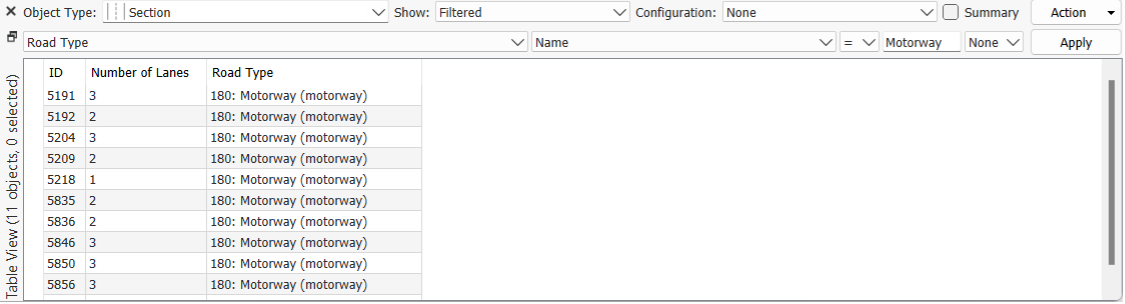
Select an object type from the drop-down box, for example Sections, to display all the objects of that type. Note that the leftmost margin of the window shows the number of objects currently being listed, and how many of them are selected in the Table View if you make any row selection. You can filter the columns on display by going to Action -> Column Visibility.
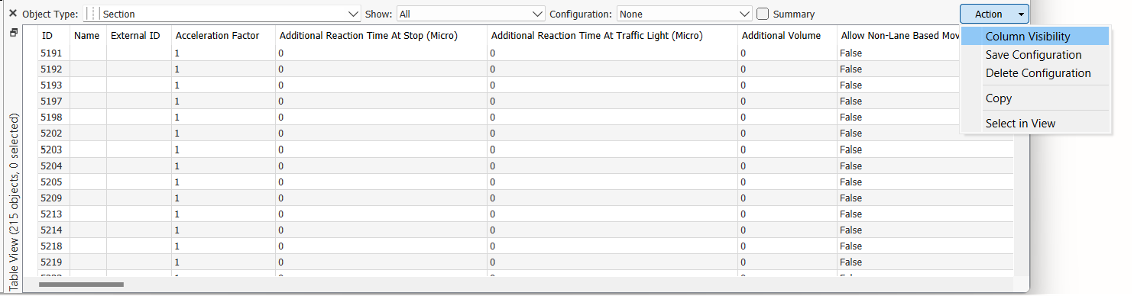
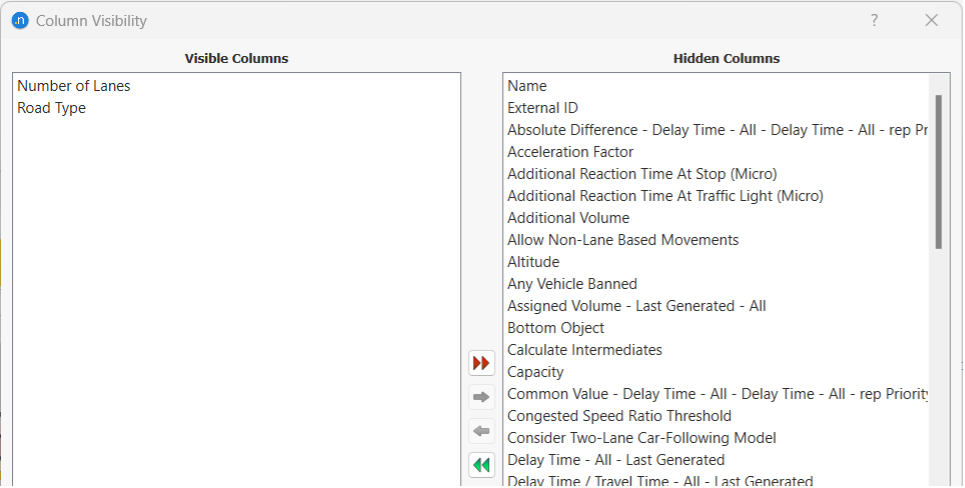
Bring all columns to the right part of the dialog Hidden Columns by pressing the double red arrow and then bring two of them back to the left side: Number of Lanes and Road Type. You can do this by either double-clicking on each of them or by selecting them and pressing the single green arrow.
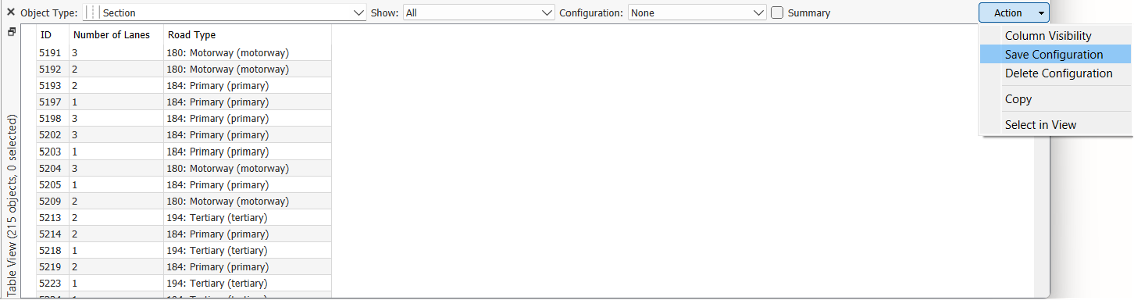
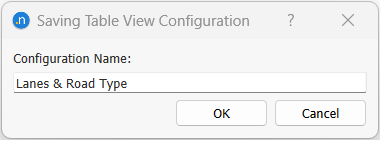
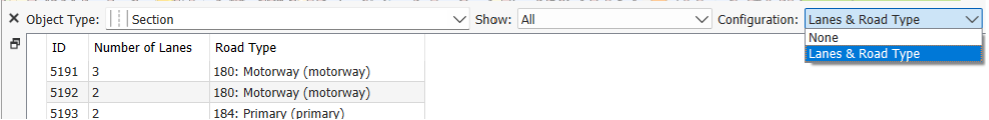
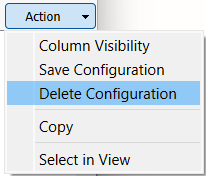
If you plan to add more sections later and might be interested in repeating this column selection, you can always store this configuration in the Action menu, Save Configuration option. This way, you can continue using the Table View and later come back to this set up by selecting the saved configuration in the corresponding Configuration dropdown list.
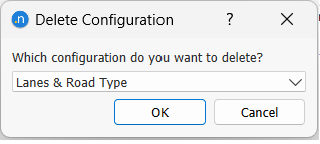
Later, you might also decide to get rid of this configuration.
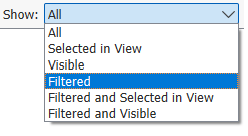
Note that the saved configuration will not only keep the information on the visible columns, but also any other filter we apply. For example, we might want to list Motorways only, we might use the Filtered option in the Show dropdown menu and define the filtering condition.
In this case, we are looking for sections whose Road Type Name is equal to Motorway.
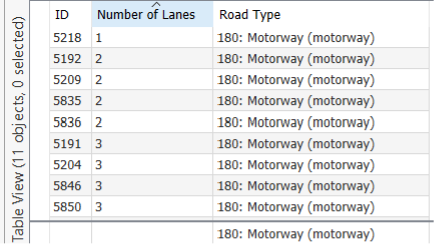
Now that we are listing only motorways, we check if all motorways have the same number of lanes by activating the Summary option. This will activate a row under the table that shows a value if all the objects in the table view have a common value; it will remain empty if several values can be found. Note that not all sections of type Motorway have the same number of lanes: if we order the contents of the table view by clicking on the header of the column Number of Lanes, we will see that there is one section that has only one lane.
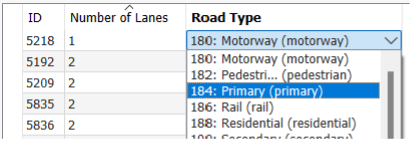
If we assume this is an error and that this section was incorrectly misclassified as a Motorway but should be of type Primary, for example, we can:
- Click on that row on the table view to center the view on the section – it will be colored in red. Double click on the section to open its properties dialog or change the type from the section context menu. Then update the road type.
- Double click on the ID 5218 and this will open the section properties dialog. Then update the road type.
- Or, you can directly edit the value of the road type within the table view, by double clicking on the road type cell of the section and selecting the right road type from the dropdown list.
After updating the road type, and under the current filter of ‘Motorway’ this section will not be listed anymore and the number of sections in the table view will decrease by one.
If we had more than one motorway section with one lane and we wanted to list only them, we would add a second filtering condition.
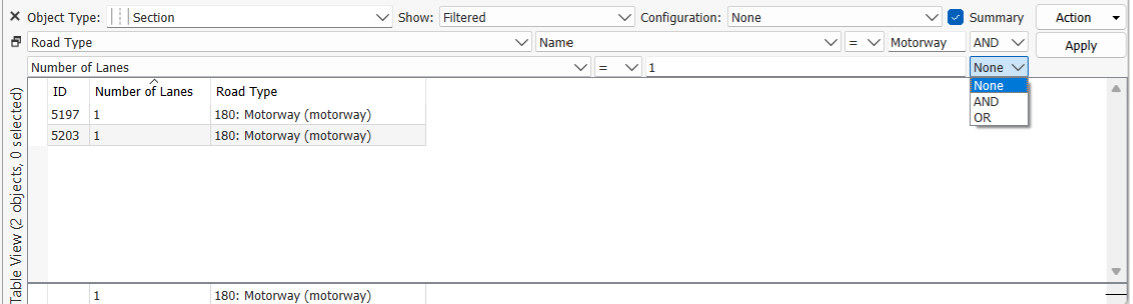
We can add as many conditions for the filtering as required, specifying whether they should all be matched (AND) or any of them (OR).
How to use the table view to edit several objects simultaneously:
Now that we filtered all the motorways that have been misclassified as motorways, we can convert them all to Primary by using the Summary row to edit the value.

Note that by modifying the road type of these two sections, there will be no section in the current scenario that has both road type Motorway and 1 lane, so the table view will be empty.
How to use the table view to easily select objects:
This option is useful to fill in the objects that should belong to a Grouping. For example, to aggregate statistics for the motorway, create a Grouping that contains all sections of type Motorway.
First, create a sections Grouping Category, then create a Grouping to contain all motorways, but then include these sections in the grouping. You can automate grouping contents by creating the grouping via a polygon but, in this case, it might not be that easy to define a polygon that includes motorways and no other section, so list motorways in the table view and look for the option Select in View in the Action menu.
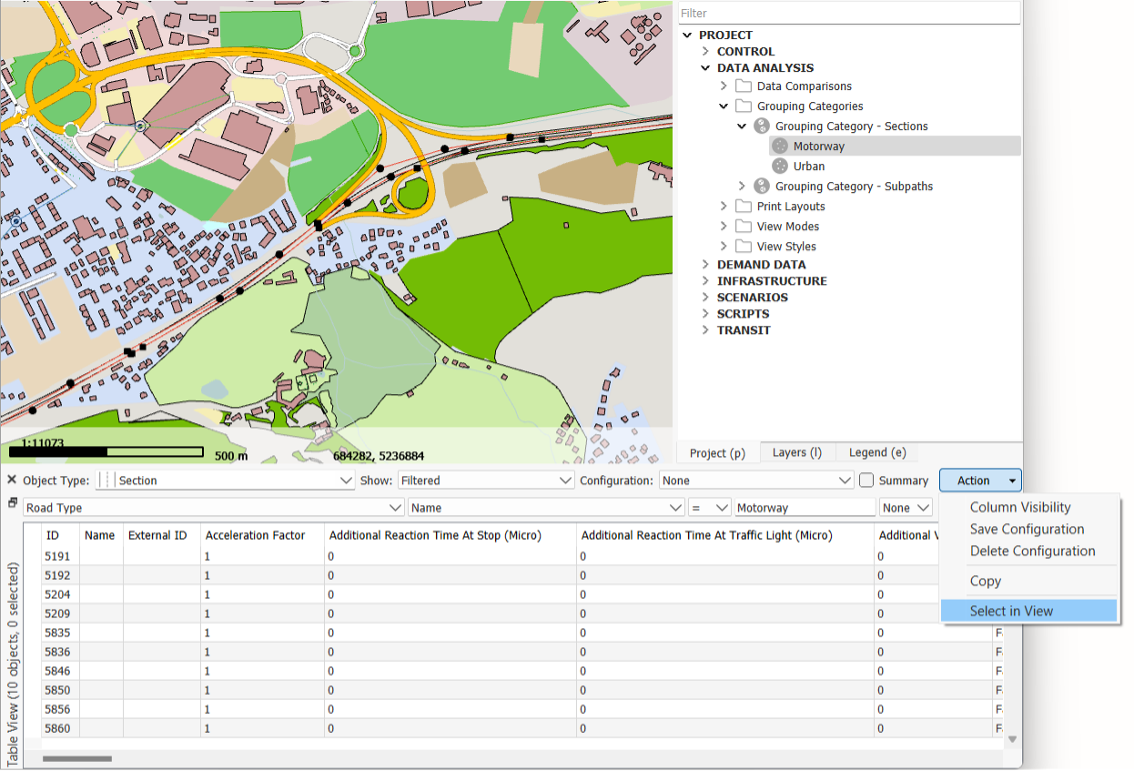
This will select all motorway sections in the view.
Next, open the grouping, and click ‘Add Selection’.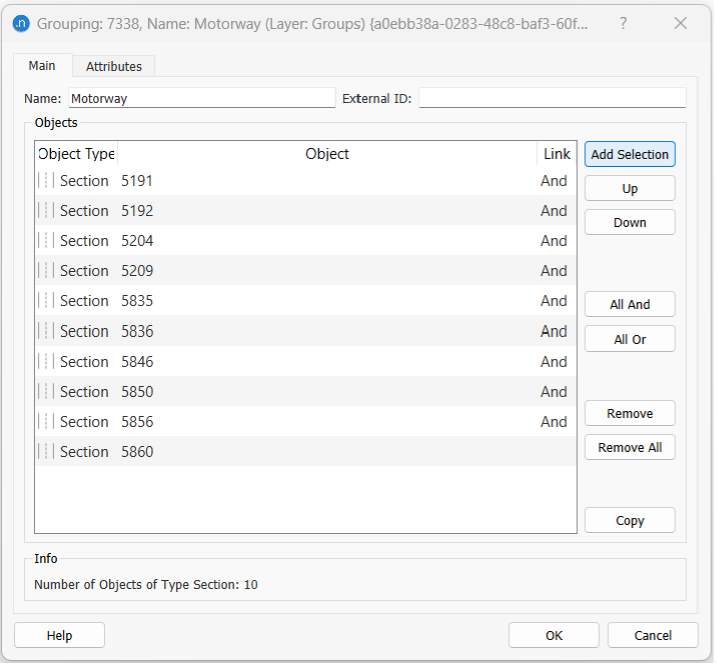
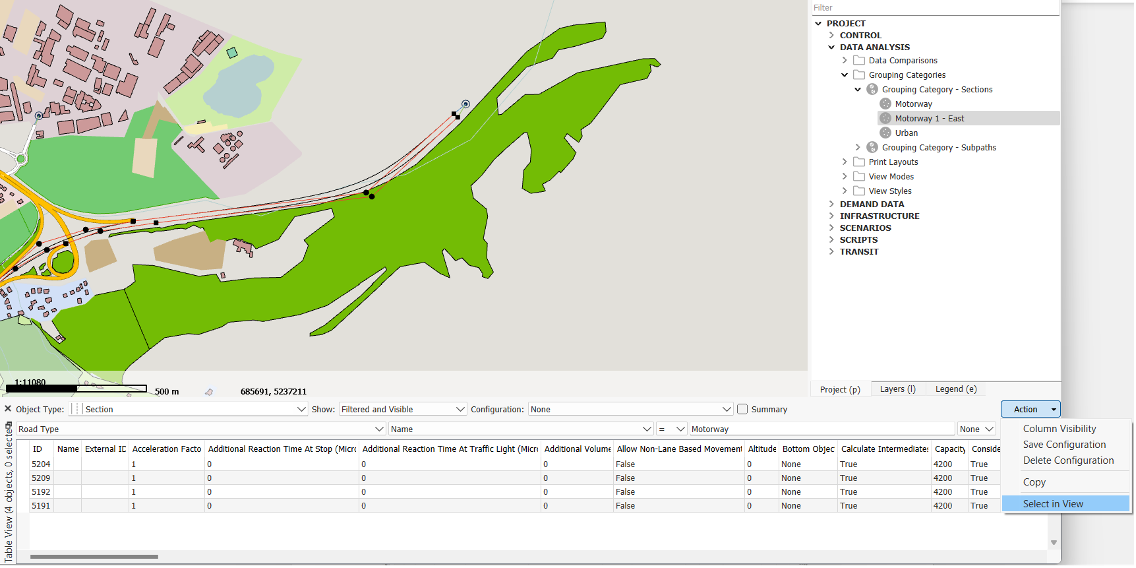
If in your model, there are three different highways and you want to separate them into different groupings, you can also use ‘Filtered and Visible and then Action -> Select in View and proceed as before.

Another useful option for filtering is the Selected in View. For example, you might want to see results only for one specific section at a time. Use this option and click on an object to empty the list except for the selected object (or objects) in view.
How to use the Table View to visualize simulation results:
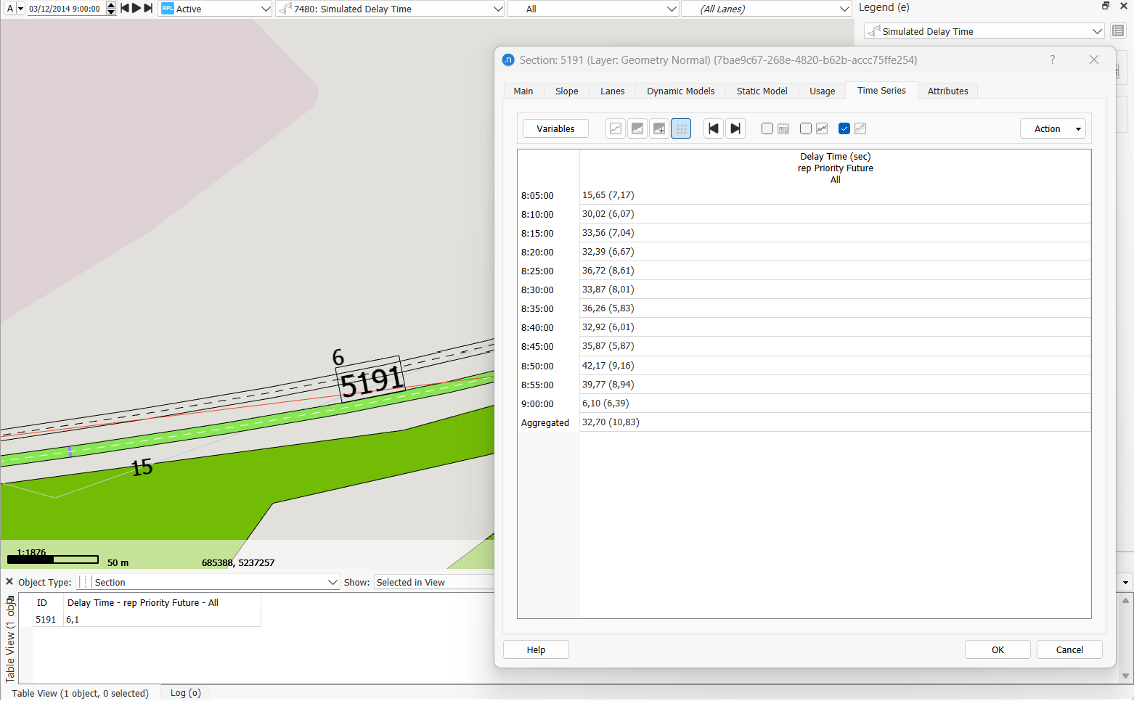
For now, we have been referring to attributes that describe the object (road type, number of lanes) but simulation results can also be visualized with the table view. And these results, for dynamic simulations, are given through time series with a statistic value per time interval. So, in the table view we can only show one at a time. The value that will be shown is then dependent on the clock context that you can find on the top left corner of the view.
Choose the exact variable(s) that you want to show, you’ll see that all cases are available (Delay Time per vehicle type, per lane, for each replication…)
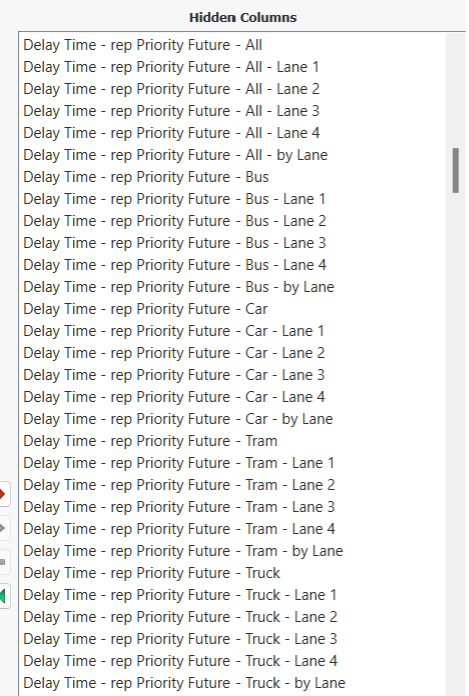
Let’s select for example the Delay Time for all vehicles and all lanes for the Priority Future replication. Move all other columns to Hidden Columns.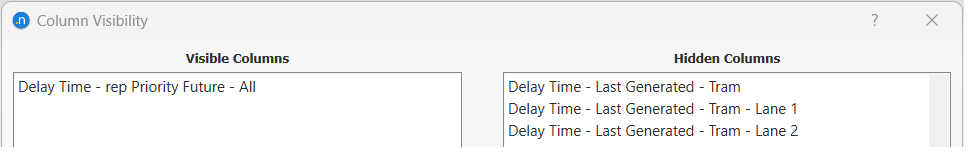
Now check the value that the table view is showing for the selected section, 6,10 sec, it’s the one corresponding to 9:00, which in fact is collected at that time but represents the aggregate statistic for the delay time of all vehicles that left the section within 8:55 and 9:00.
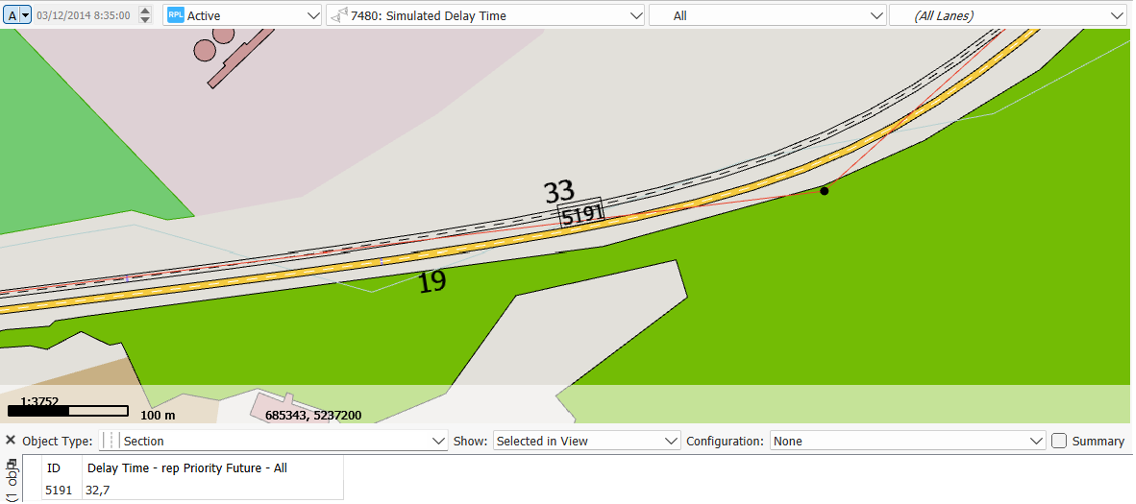
If you select another time in the clock, or press the A button, the content of the table view will accordingly change.
In summary, the Table View is a very powerful tool that can make you more efficient in all modelling stages: when editing, when calibrating and when reviewing the final results.