Taking cost-benefit analysis to the next dimension: how LEVITATE gave us a glimpse of a possible future.

Mark Brackstone
Acting Head of Research Projects at Aimsun
Do you remember what professional life was like before COVID-19 appeared? In the days when attending virtually was only an emergency option to be used when other unavoidable appointments prevented devoting substantial blocks of time to one activity? It was in these times (December 2019 to be exact) that the Horizon2020 funded LEVITATE Project started, in a time when formal wear wasn’t obsolete, and ties were still widely available in shops. I have clear memories of our kick-off meeting at Loughborough University as it would be the first, and almost the last, face-to-face meeting for the project, which showed incredible resilience in not only delivering their objectives, but also adapting to a new way of working that we now take for granted.
The broad idea of the Project was to explore and generate a cost benefit analysis (CBA) tool with which stakeholders could make judgements as to what ITS measures (specifically, CCAM measures such as Autonomous Vehicles (AVs)) could be deployed in their jurisdictions, to best benefit the public, allowing trade-offs to be visible between for example, congestion reduction, investment cost, and deployment strategy. Such an idea isn’t new of course and cost benefit tools along these lines have been slowly developing for some decades, for example in the UK through the DfT, pre-dating the current TAG guidance and tools such as COBA etc, and through the FHWA in the USA (https://ops.fhwa.dot.gov/plan4ops/topsbctool/index.htm). Indeed this is a road the European Commission has ventured down before too, having funded, for example, the 2DECIDE Project within FP7 in 2009 (https://cordis.europa.eu/project/id/233608). LEVITATE was however perhaps the first effort in this direction that, rather than just cataloguing findings, attempted to understand how findings for City A, implemented under conditions B, {A, B}, could be used to give results for City C, under conditions D, {C, D}. But more to the point, to do this without undertaking vast amounts of costly additional research. In other words, to understand transferability.
At this point, many end users would quite naturally ask, ‘Why bother? How complex (read expensive) could this possibly be’? The answer is, if one isn’t rather clever about it, VERY. Why? Well, the scale of this becomes clear when we consider how ‘dimensionality’ effects the modelling of CCAM measures. Typically, to investigate a system and assess its impact, we set up a model of an area, which is calibrated to a set standard. (This in itself can easily take man years of effort). The system under investigation is then parameterised. To draw an example here let’s look at the implementation of an autonomous vehicle fleet. Here we need to say what % of the vehicle fleet would be AVs? Would this just encompass cars or other vehicle types? How would they operate? How fast would they accelerate/decelerate? How fast could they drive? What types of road could they use? What would be their minimum headway? What kinds of gaps would they accept at junctions? How quickly would they react to stimuli? Here I’ve just listed nine off the cuff variables. The same would be true for example for variable speed limits: what % of drivers would observe the speed limit? Would they decelerate after or before the sign? How quickly etc etc. This breadth of these questions is what we term, ‘dimensionality’. It’s plain to see that even if for each question in our AV example, we only allow 3 values (answers) to be selected (eg. headway = short, normal, long), then we have a space to investigate of 3^9 combinations. Given that to ensure stability and convergence in simulation we always look at a number of replications (let’s conservatively say 5) this points at having to undertake almost 10,000 simulations. On top of that, one then has to ask – how do I assess impact and changes? Speed? Density? Emissions? Where on the network? Again, another different sort of dimensionality. And another man year of a junior analyst creating thousands of excel graphs that the client may have to wade through. To examine such a wide range of questions, and obtain such a wide range of answers, is clearly prohibitive then.
I have to a certain extent dramatized the process in the example above, and there are many clever shortcuts that can be taken, for example not all of the 3^9 combinations may be physically possible. Also, after consultation with industry and results from field trials we may find that some combinations have already been ruled out on practicality grounds. Even so – the size of the problem is still staggering. And once you’ve done {A, B}, do you really have to go back in, start over and undertake {C, D}? Frighteningly, does one have to do this for every City before understanding the implications for technology roll-out?
So how to deal with this? Is the quest to build a useful cost-benefit tool for advanced CCAM systems forever damned by the curse of dimensionality? Forever, no, delayed, perhaps, while we develop and derive new methods, and here there are perhaps three directions that LEVITATE identified, in which we can advance. The first of these has been examined in a previous blog by one of my Aimsun colleagues (https://www.linkedin.com/pulse/taking-micro-macro-scaling-impact-assessment-vehicles-tympakianaki/) as well as in a number of papers since (Gasparinatou et. al., 2022), and this involves simplifying our output space, and allowing us to turn a detailed analysis into something more macroscopic. This in turn allows us to produce, comparatively quickly, findings for a small number of City and condition combinations, and robustly present findings using intuitive indicators (such as network travel times) that can easily be understood by decision makers.
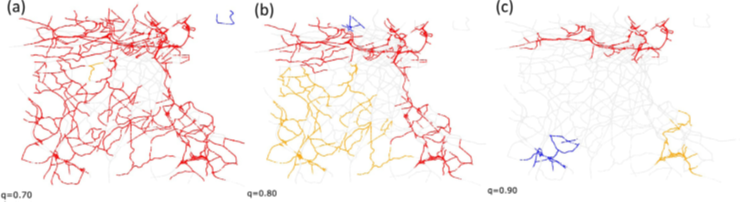
The second direction is obtaining a better understanding of any network, whereby, rather than blindly (or randomly) simulating all the roads in a specific area, we can identify those that are most critical to its operation in differing ways, thereby allowing us to cut down the network that we use to a bare minimum, speeding up simulations, and expediting analysis. Work on understanding such network resilience is already underway around the globe and has been undertaken with a range of motivations, not only to understand traffic engineering and science questions (eg. Chalkiadakis et. al., 2022) but also as a critical motivation in the cyber security of CCAM systems (eg. Vivek and Conner, 2022), driven by a need to understand network ‘hot spots’ and pinch points, where stalled or hacked vehicles may have the most overall impact. (For an excellent overview of the topic see Sugishita and Asakura, 2021).
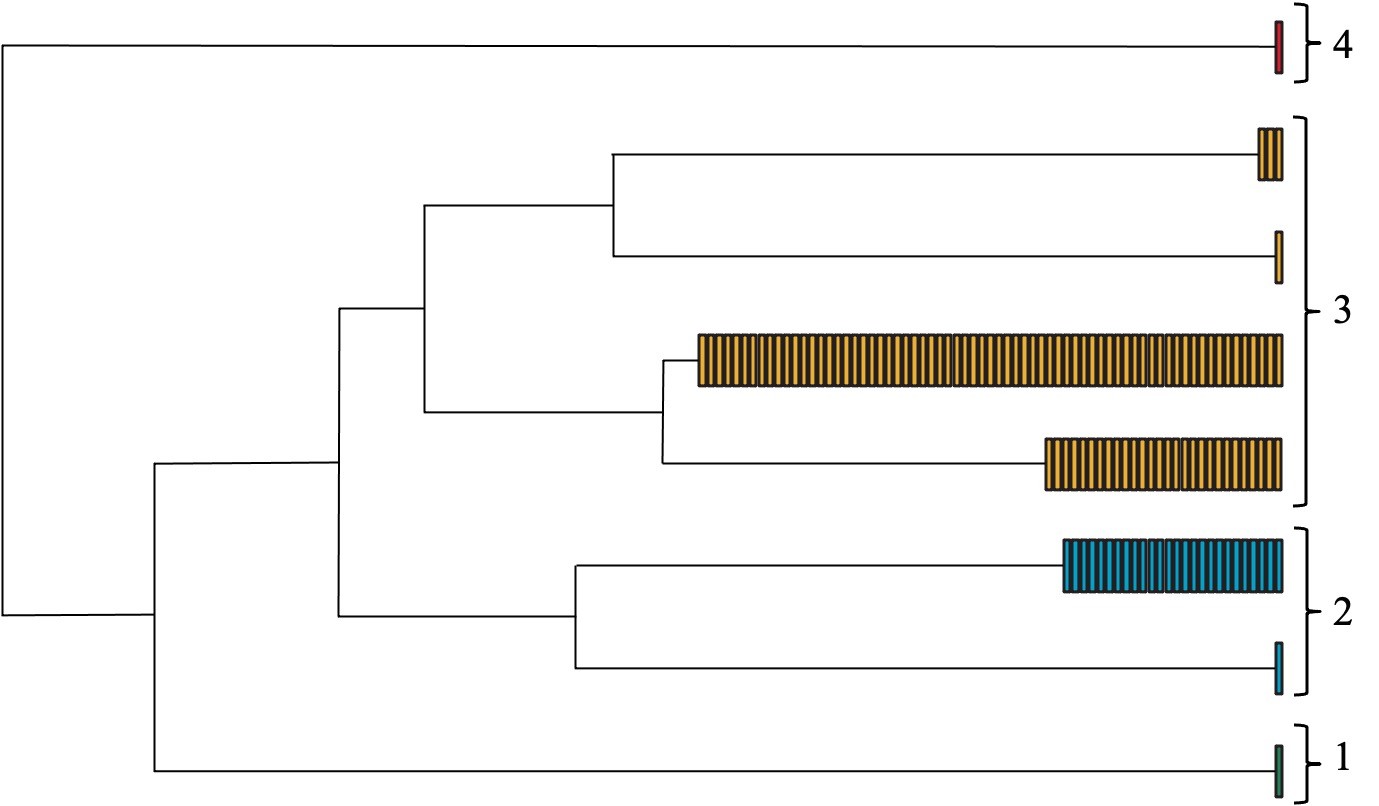
While these techniques are all important in making cost-benefit analysis both more complete and transparent, perhaps the most tantalising prospect is offered in understanding City typology and morphology, in other words, trying to characterise areas in terms of a common set of parameters, so that systematic comparisons can easily be made (eg. Louf and Barthelemy, 2014), effectively reducing the dimensionality with which we describe cities. In doing so we could stop using the phrase ‘every city is different’ and replace it instead with the rather less catchy (and metaphorical) ‘every city has its own genotype’.
So where does this leave us? While there is clearly still a long way to go, the ideas taken forward and brought together in LEVITATE have demonstrated that a fully functioning and widely applicable CCAM-CBA tool could be well be possible, and while not the root source of the ideas, may be remembered as the project that brought them together, in an environment where the impact of the synergy between them was first was first realised.
References
Chalkiadakis, C., Vlahogianni, E. and Perdikouris, A. (2022). Urban Road Network Resilience Metrics and their Relationship: Some Experimental Findings. Proc. Of the 101st Transportation Research Board Annual Meeting, Washington D.C. Paper TRBAM-21-03215.
Gasparinatou, C., Oikonomou, M., Tympakanaki, A. and Casas, C. et al. (2022). Passenger Car Unit Values of Connected Autonomous Vehicles in Urban Road Networks. Proc. Of the 101st Transportation Research Board Annual Meeting, Washington D.C. Paper TRBAM-22-00823.
Louf, R, and Barthelemy M. (2014). A typology of street patterns. J. R. Soc. Interface 11: 20140924. http://dx.doi.org/10.1098/rsif.2014.0924.
Sugishita, K., Asakura, Y. (2021). Vulnerability studies in the fields of transportation and complex networks: a citation network analysis. Public Transp 13, 1–34 (2021). https://doi.org/10.1007/s12469-020-00247-9
Vivek, S. and Conner, H. (2022). Urban road network vulnerability and resilience to large-scale attacks. Safety Science, Volume 147, 2022, 105575, ISSN 0925-7535, https://doi.org/10.1016/j.ssci.2021.105575.
